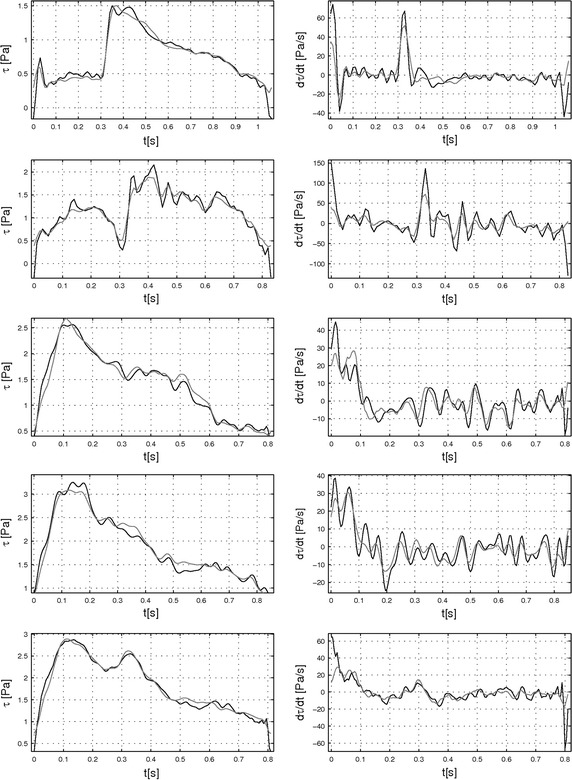
It is a known fact that blood flow pattern and more specifically the pulsatile time variation of shear stress on the vascular wall play a key role in atherogenesis. The paper presents the conception, the building and the control of a new in vitro test bench that mimics the pulsatile flows behavior based on in vivo measurements.
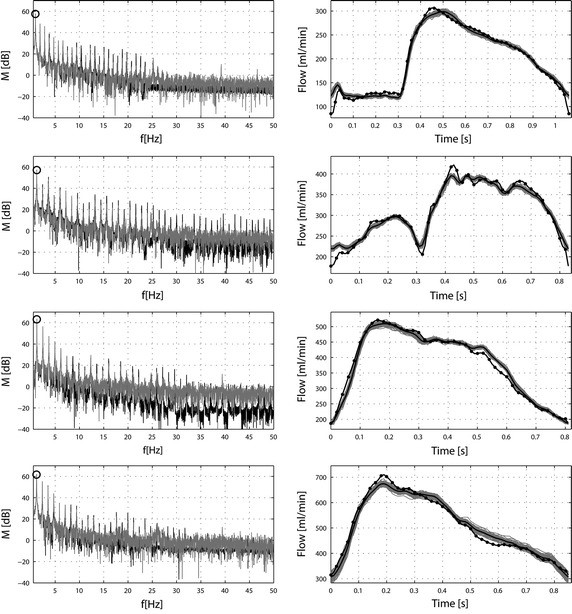
An in vitro cardiovascular simulator is alimented with in vivo constraints upstream and provided with further post-processing analysis downstream in order to mimic the pulsatile in vivo blood flow quantities. This real-time controlled system is designed to perform real pulsatile in vivo blood flow signals to study endothelial cells’ behavior under near physiological environment. The system enables to mimic any resulting blood flow rate patterns between 40 and 700 ml/min. In order to feed the system with reliable periodic flow quantities in vivo measurements were performed. Data from five patients (1 female, 4 males; ages 44-63) were filtered and post-processed using the Newtonian Womersley’s solution. These resulting flow signals were compared with 2D axisymmetric, numerical simulation using a Carreau non-Newtonian model to validate the approximation of a Newtonian behavior.